Often when creating plots and visuals I like them to be highly customized. I found I routinely came back to a few themes. Thus, I created several functions to make applying themes to plots and adding elements to plots a little easier.
theme_cole()
theme_cole() is a custom ggplot2 theme
designed to provide a restrained, manuscript-like aesthetic. The goal
was not heavy ornamentation, but a clean default that:
- Emphasizes titles and axes
- Reduces unnecessary visual noise
- Provides fine-grained control over axis lines
- Supports dark mode and transparent backgrounds
Design principles
The theme is built on top of theme_minimal() and
modifies only a focused set of elements:
- Typography: bold titles, slightly larger legend text
- Layout: increased margins and centered titles
- Axes: explicit control over which axes are shown
- Backgrounds: light, dark, or transparent
The intent is that the theme works across many plot types without requiring per-plot tweaking.
Basic usage
library(ggplot2)
library(palmerpenguins)
library(trashpanda)

p <- ggplot(penguins, aes(flipper_length_mm, bill_length_mm)) +
  geom_point()

p + theme_cole()
By default:
- Grid lines are retained
- Axis lines appear only on the bottom and left
- Light background is used
Grid control
Grid lines can be fully removed using
remove_grid = TRUE.
p + theme_cole(remove_grid = TRUE)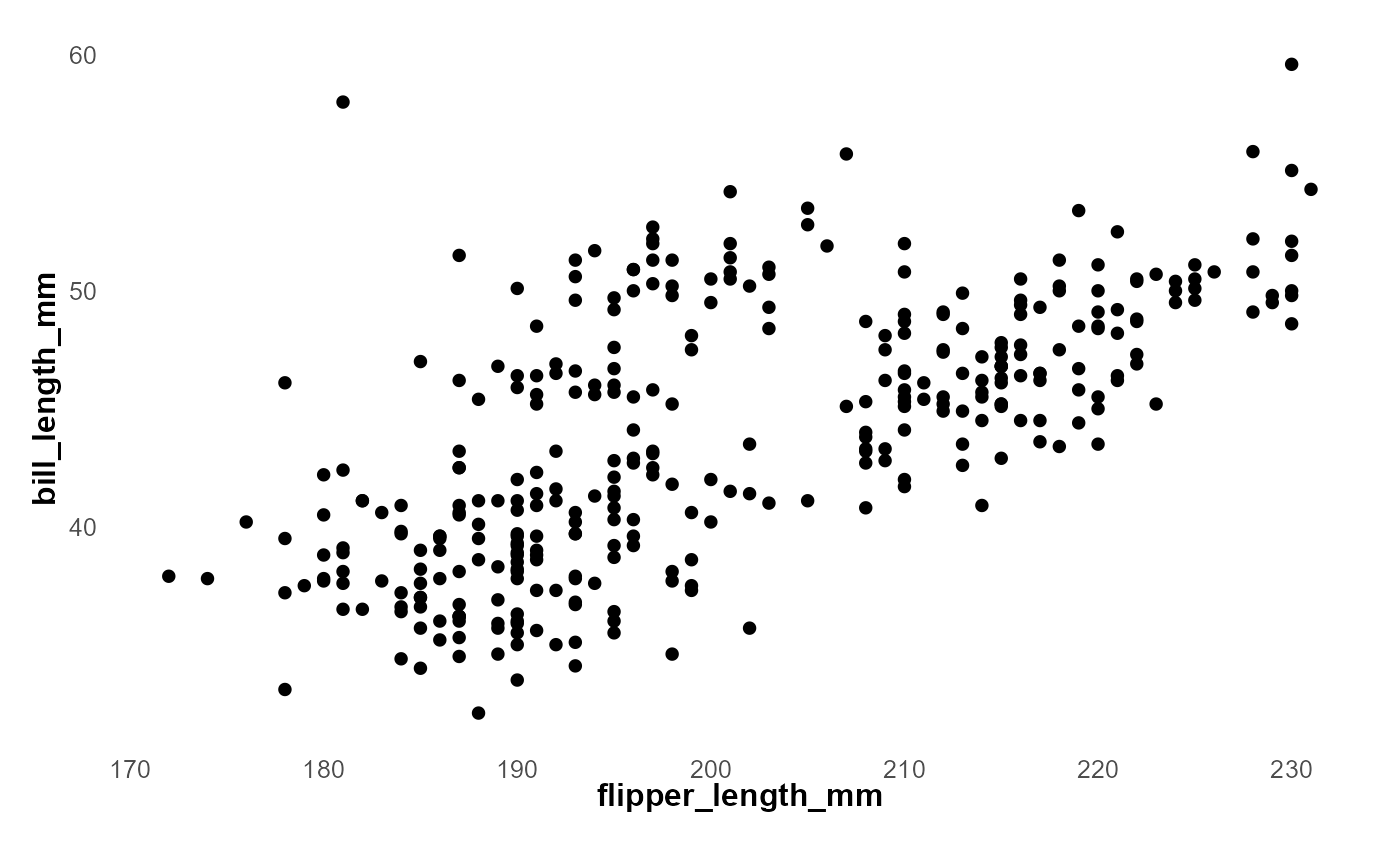
This is useful for presentation-style figures or plots intended to resemble hand-drawn charts.
Dark mode
Setting dark = TRUE switches the theme to a dark
background while preserving contrast and readability.
p + theme_cole(dark = TRUE)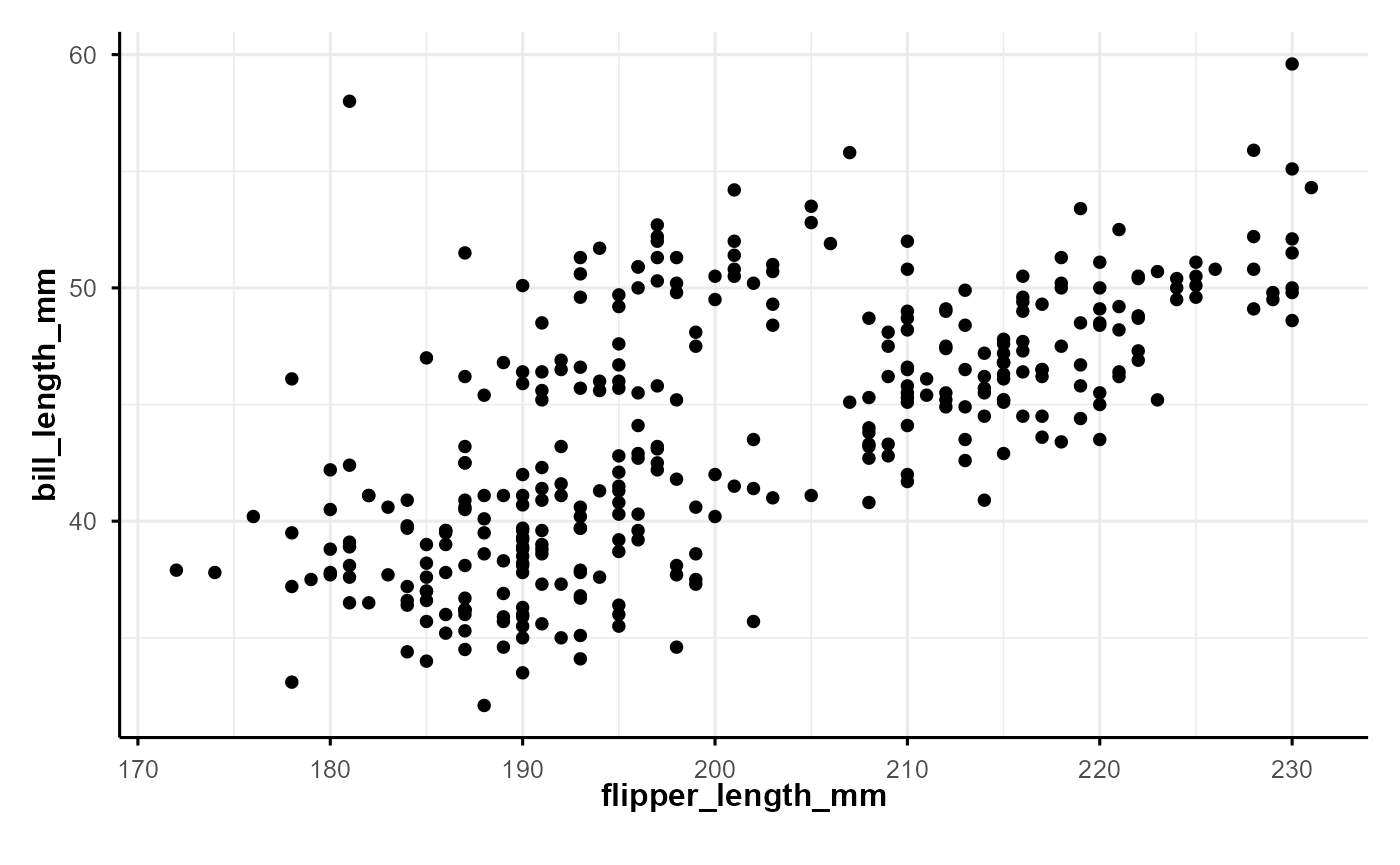
Dark mode changes:
- Plot and panel backgrounds
- Grid line colors
- Text, axis, and legend colors
Axis line color is automatically adjusted to white.
Transparent backgrounds
For slides, overlays, or compositing figures, a transparent background can be requested:
p + theme_cole(transparent = TRUE)
This affects:
- Plot background
- Panel background
- Legend and strip backgrounds
Note that transparency applies only in light mode.
Typography and sizing
The theme exposes standard sizing parameters:
-
base_size: base font size (default 12) -
base_family: font family (default"sans")
Titles are scaled relative to base_size:
- Plot title:
1.5 × base_size - Legend title:
1.2 × base_size
This keeps proportions consistent across outputs.
Example: publication-style scatter plot
ggplot(penguins, aes(flipper_length_mm, bill_length_mm, fill = species)) +
  geom_point(shape = 21, size = 3) +
  labs(
    title = "Flipper Length vs Bill Length",
    subtitle = "Palmer Penguins dataset"
  ) +
  theme_cole(remove_grid = TRUE)
This configuration emphasizes data points and labels while minimizing distractions.
Example: dark presentation slide
ggplot(penguins, aes(flipper_length_mm, bill_length_mm, color = species)) +
  geom_point(size = 2) +
  labs(title = "Penguin Morphometrics") +
  theme_cole(dark = TRUE, remove_grid = TRUE)
When to use theme_cole()
This theme works best when:
- You want consistent, restrained styling across figures
- Axis placement matters (e.g., publication or teaching figures)
- You need light, dark, and transparent variants without redefining themes
It is intentionally opinionated but avoids heavy stylistic elements so it can be layered with captions, annotations, and custom geoms.
Summary
theme_cole() provides:
- A clean extension of
theme_minimal() - Explicit axis-line control
- Dark and transparent modes
- Sensible typography defaults
The implementation prioritizes clarity, reuse, and predictable behavior across plotting contexts.