Overview
This vignette documents the “plot extras” functionality in the package, including:
- Adding social media captions to plots and tables
- Readable numeric formatting with commas
- Colour palettes and scales for ggplot2
These functions enhance visualization without altering the core plotting logic.
1. Adding a caption with add_caption_cwb()
add_caption_cwb() allows you to add a social media
caption to ggplot2 plots. It supports GitHub and Bluesky usernames and
optionally includes a data source.
Example: ggplot2 plot
library(ggplot2)
library(trashpanda)

p <- ggplot(mpg, aes(displ, hwy)) +
  geom_point() +
  labs(title = "Displacement vs Highway MPG")

p + add_caption_cwb(type = "plot", github_username = "colebaril", include_data_source = TRUE, data_source = "mpg dataset")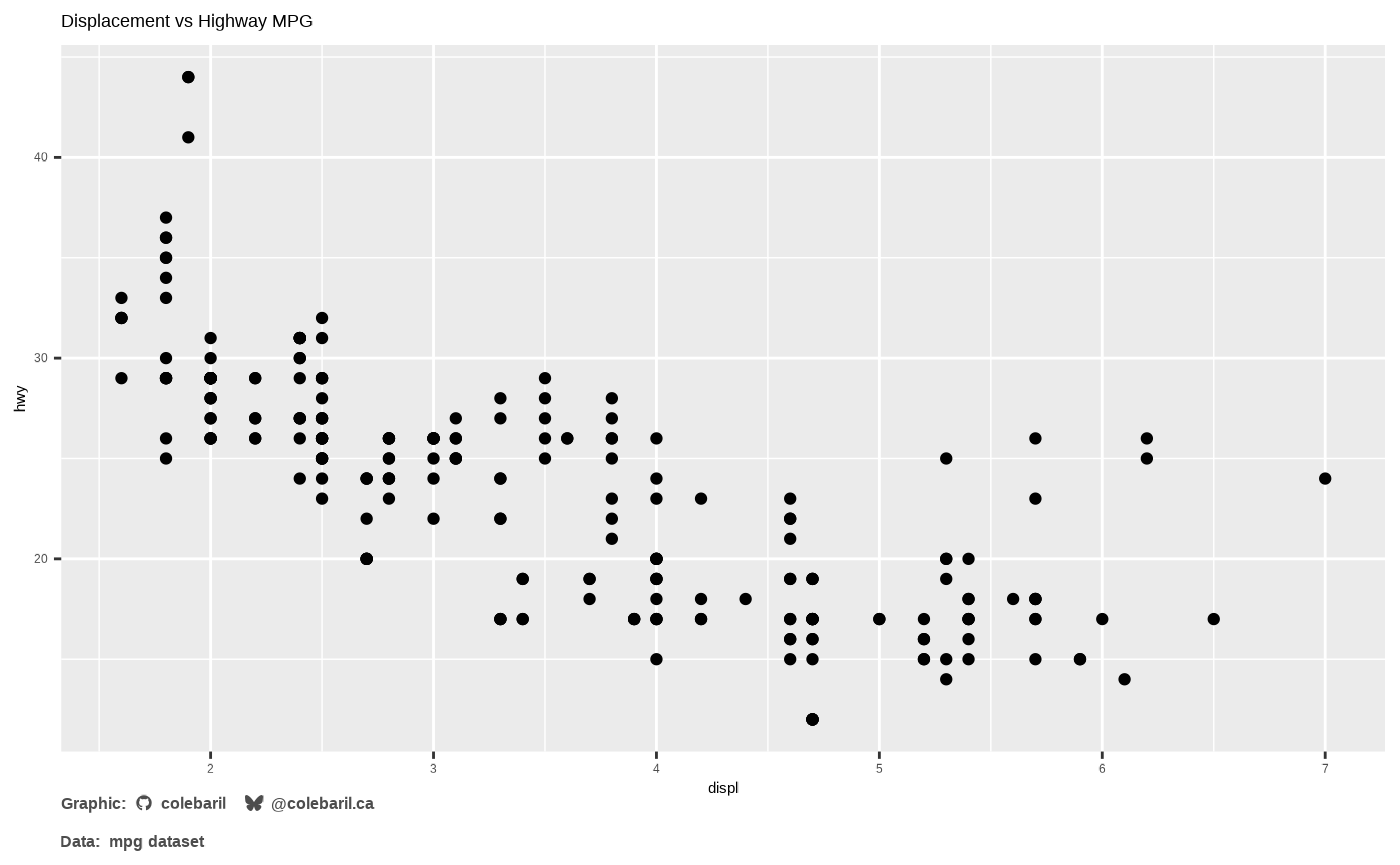
2. Numeric formatting with add_commas()
add_commas() formats large numbers with commas for
easier readability.
x <- c(1000, 25000, 1234567)
add_commas(x)
## [1] " 1,000" " 25,000" "1,234,567"
#> "1,000" "25,000" "1,234,567"This is particularly useful for labeling axes or tables where numeric readability is important.
3. Colour palettes and scales
The package includes curated palettes for different visual moods.
Examples include arcane_flame,
enchanted_forest, mystic_ocean, and more.
Using a discrete palette
ggplot(mpg, aes(class, fill = class)) +
  geom_bar() +
  scale_cwb(palette = "discrete_21", type = "d", aesthetics = "fill")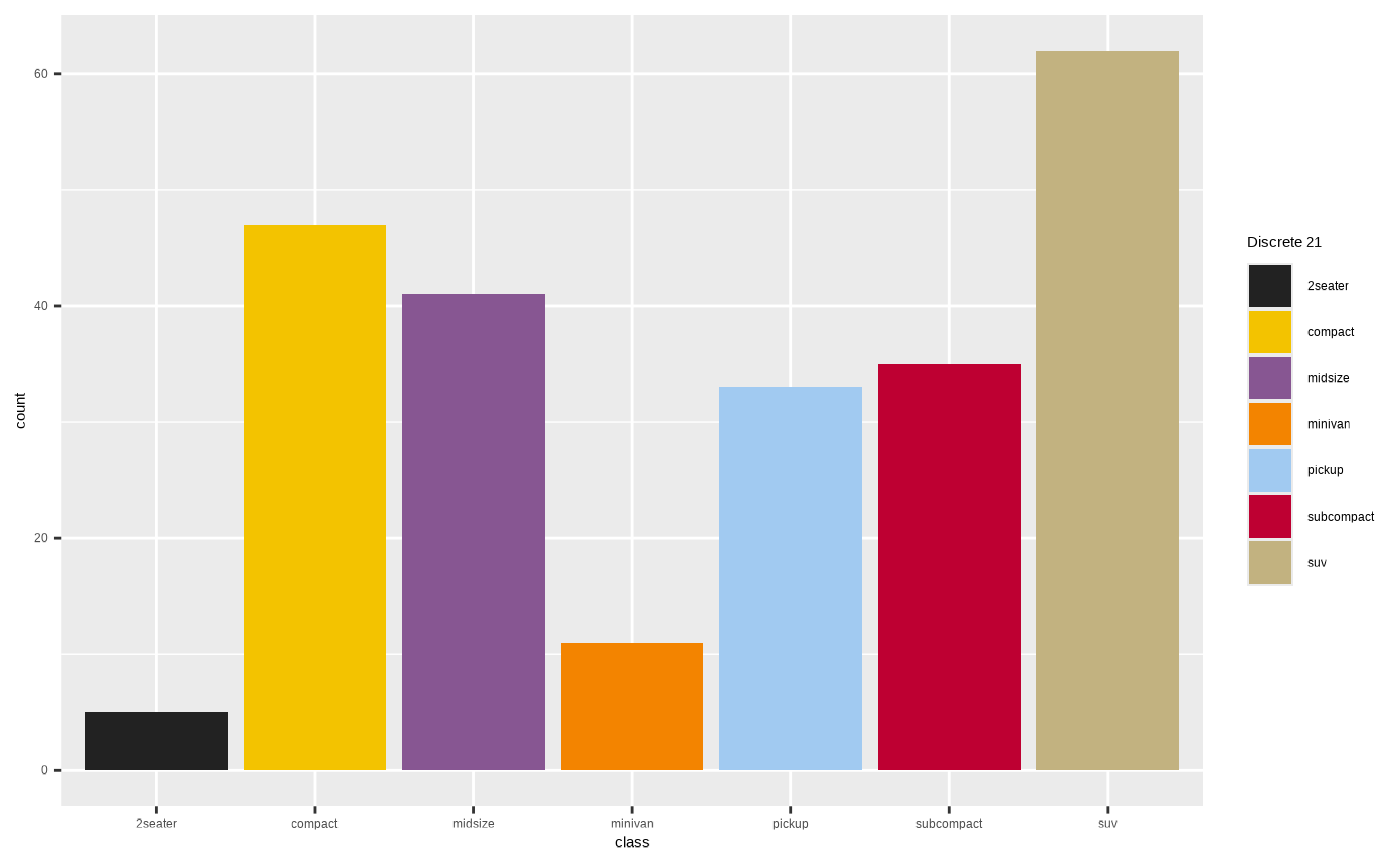
Using a continuous palette
ggplot(mpg, aes(displ, hwy, colour = hwy)) +
  geom_point(size = 3) +
  scale_cwb(palette = "mystic_ocean", type = "c", aesthetics = "colour")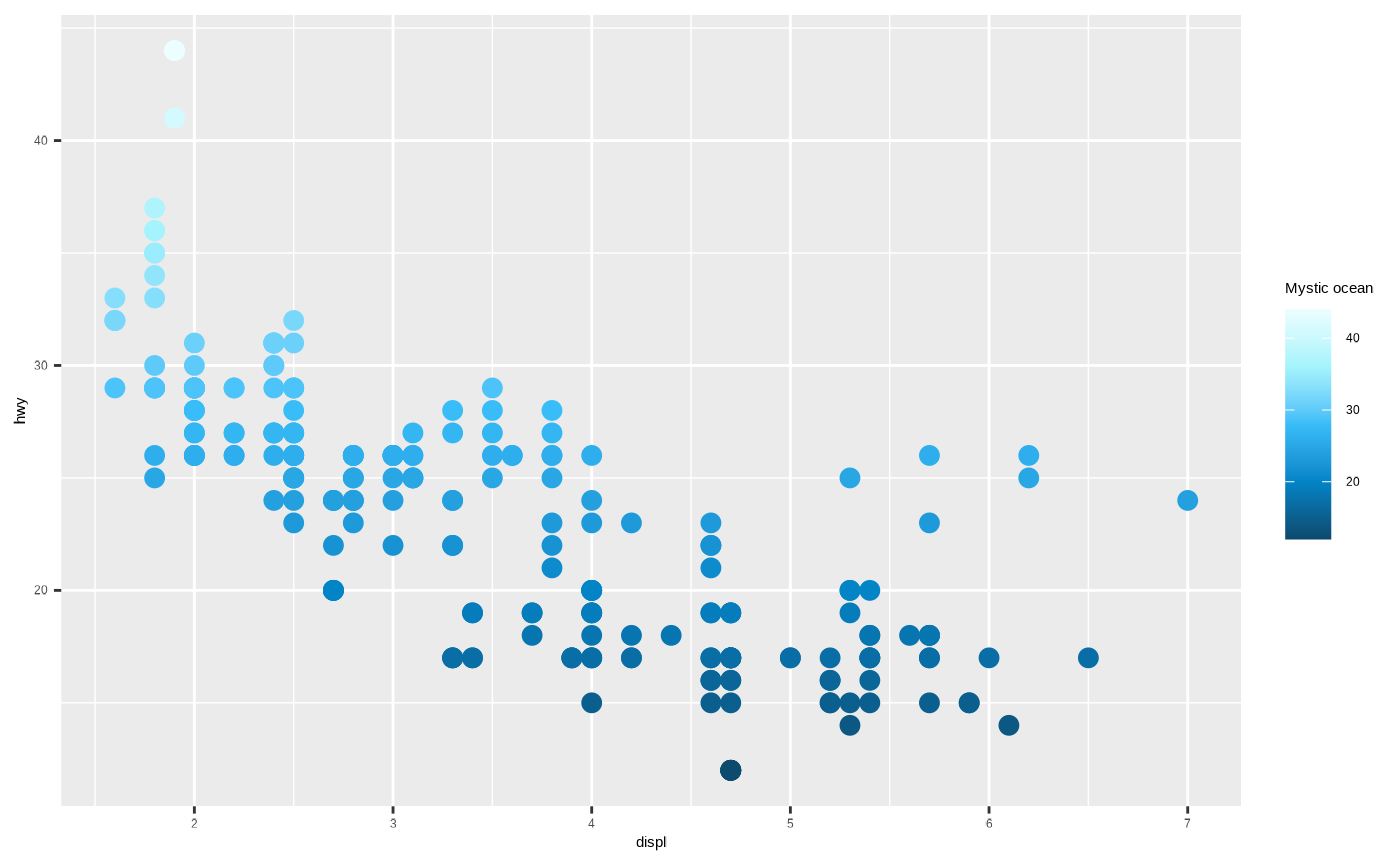
Summary
This vignette highlights utility functions that enhance plots and tables:
-
add_caption_cwb()for social media and data source captions -
add_commas()for readable numeric labels -
scale_cwb()for applying curated palettes
These extras integrate seamlessly with ggplot2 and
gt objects to streamline polished figure creation.