require(pacman)
p_load(tidyverse, trashpanda, wordcloud2)

df <- trashpanda::get_tidytuesday_meta()My TidyTuesday Visualized
Load Libraries & Data
Packages Used
packages <- df |>
  select(packages) |>
  unnest(packages) |>
  summarise(n = n(),
            .by = packages) |>
  filter(packages != "")

ggplot(packages, aes(x = reorder(packages, n), y = n)) +
  geom_col(fill = "steelblue") +
  coord_flip(expand = FALSE, clip = "off") +   # horizontal bars for readability
  labs(
    title = "Most frequently used packages",
    x = "Package",
    y = "Count of usage"
  ) +

  theme_cole(remove_grid = TRUE, base_size = 16)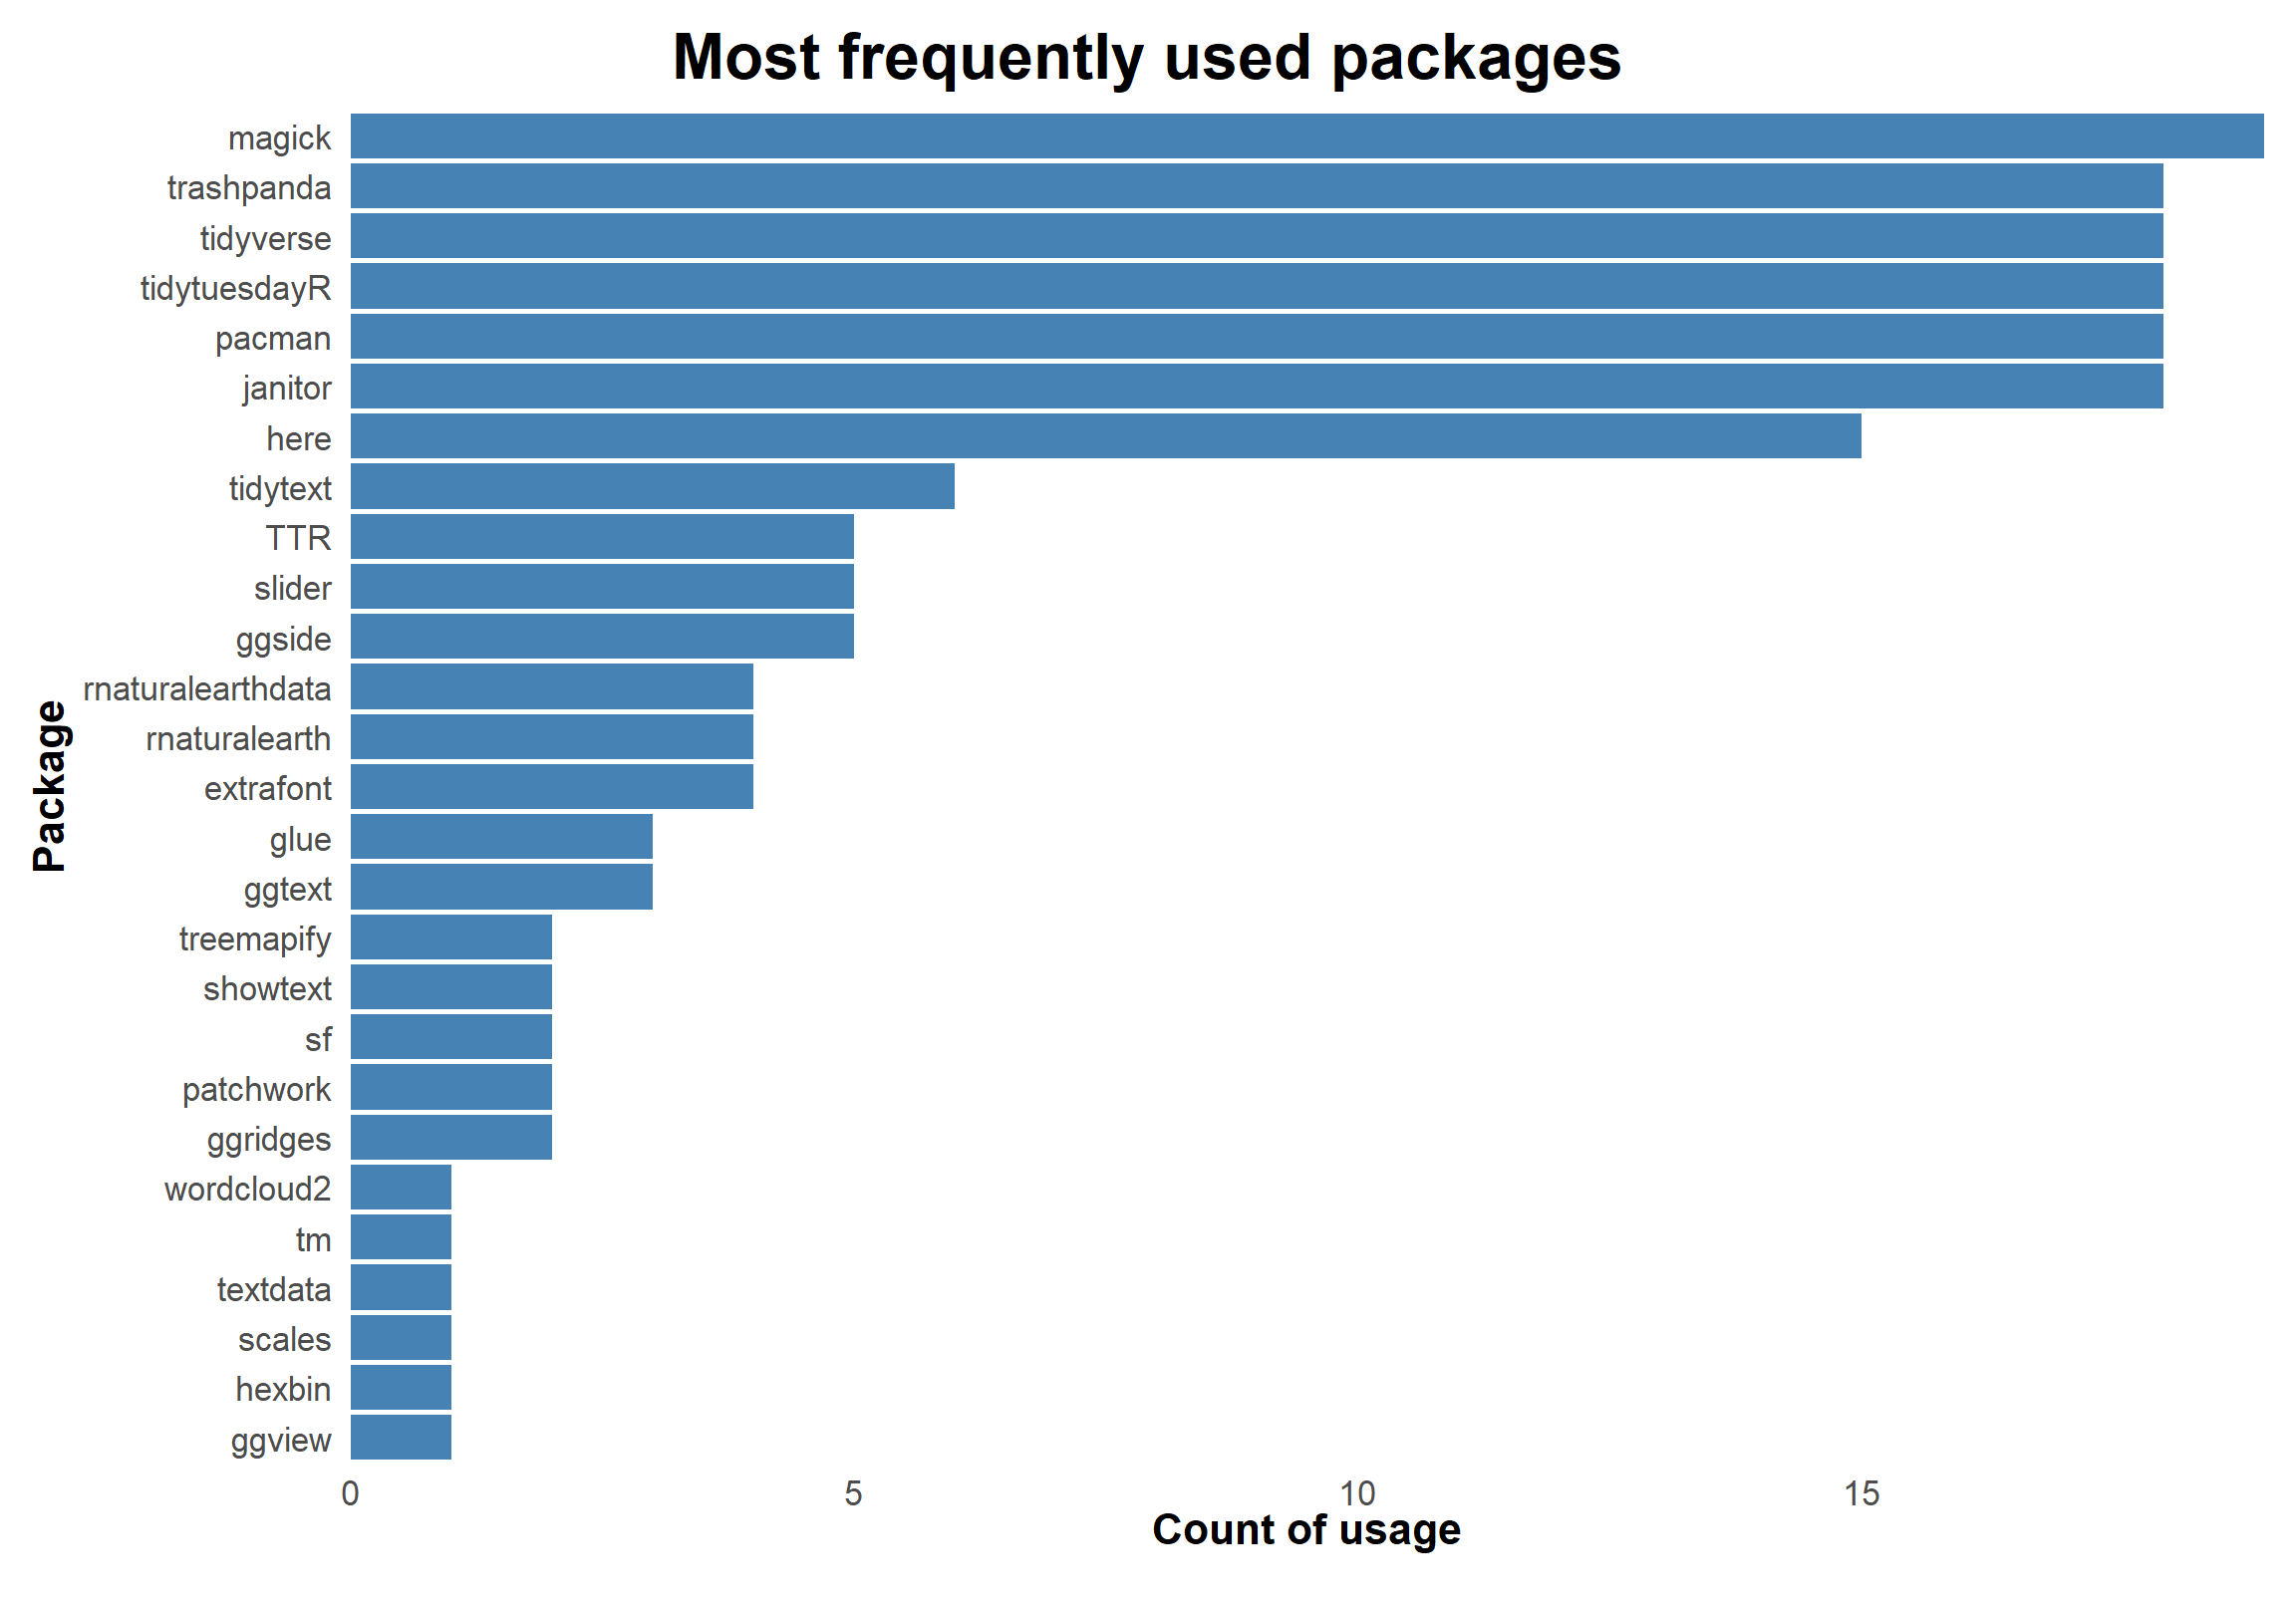
Data Retrieval
To retrieve data from the scripts I wrote to create TidyTuesday visualizations, I created a custom function, get_tidytuesday_meta() as part of my trashpanda package. All .qmd files are scraped and an algorithm extracts various data from each script.
The types of metadata extracted include:
- Titles & categories
- Number of lines and comments
- Lists of functions used in each script
- Lists of packages used in each script
- Plot types used in each script
See a glimpse of the data below:
glimpse(tidytuesday_meta)Rows: 16
Columns: 10
$ file_path <chr> "2025/2025-01-21 - Himalayan Mountaineering/2025-01-21 …
$ title <chr> "Himalayan Mountaineering", "US Weekly Gas Prices", "Ex…
$ date <chr> "2025-01-21", "2025-07-01", "2025-08-12", "2025-08-19",…
$ categories <list> <"mountains", "Himalayas">, "economics", <"climate", "…
$ image <chr> "mountaineering_success.png", "us_gas.png", "att_studie…
$ num_lines <int> 128, 123, 94, 128, 68, 89, 183, 140, 37, 95, 132, 172, …
$ num_comments <int> 11, 11, 10, 14, 9, 10, 11, 11, 5, 9, 8, 9, 9, 9, 10, 9
$ functions_used <list> <"require", "p_load", "tt_load", "left_join", "clean_na…
$ packages <list> <"pacman", "tidytuesdayR", "magick", "tidyverse", "jan…
$ plot_types <list> <"point", "errorbar", "text">, "line", <"point", "smoo…To retrieve data, simply run the function:
df <- trashpanda::get_tidytuesday_meta()