require(pacman)
p_load(tidytuesdayR, magick, tidyverse, janitor, trashpanda, treemapify)Science Foundation Ireland Grants
science
finance
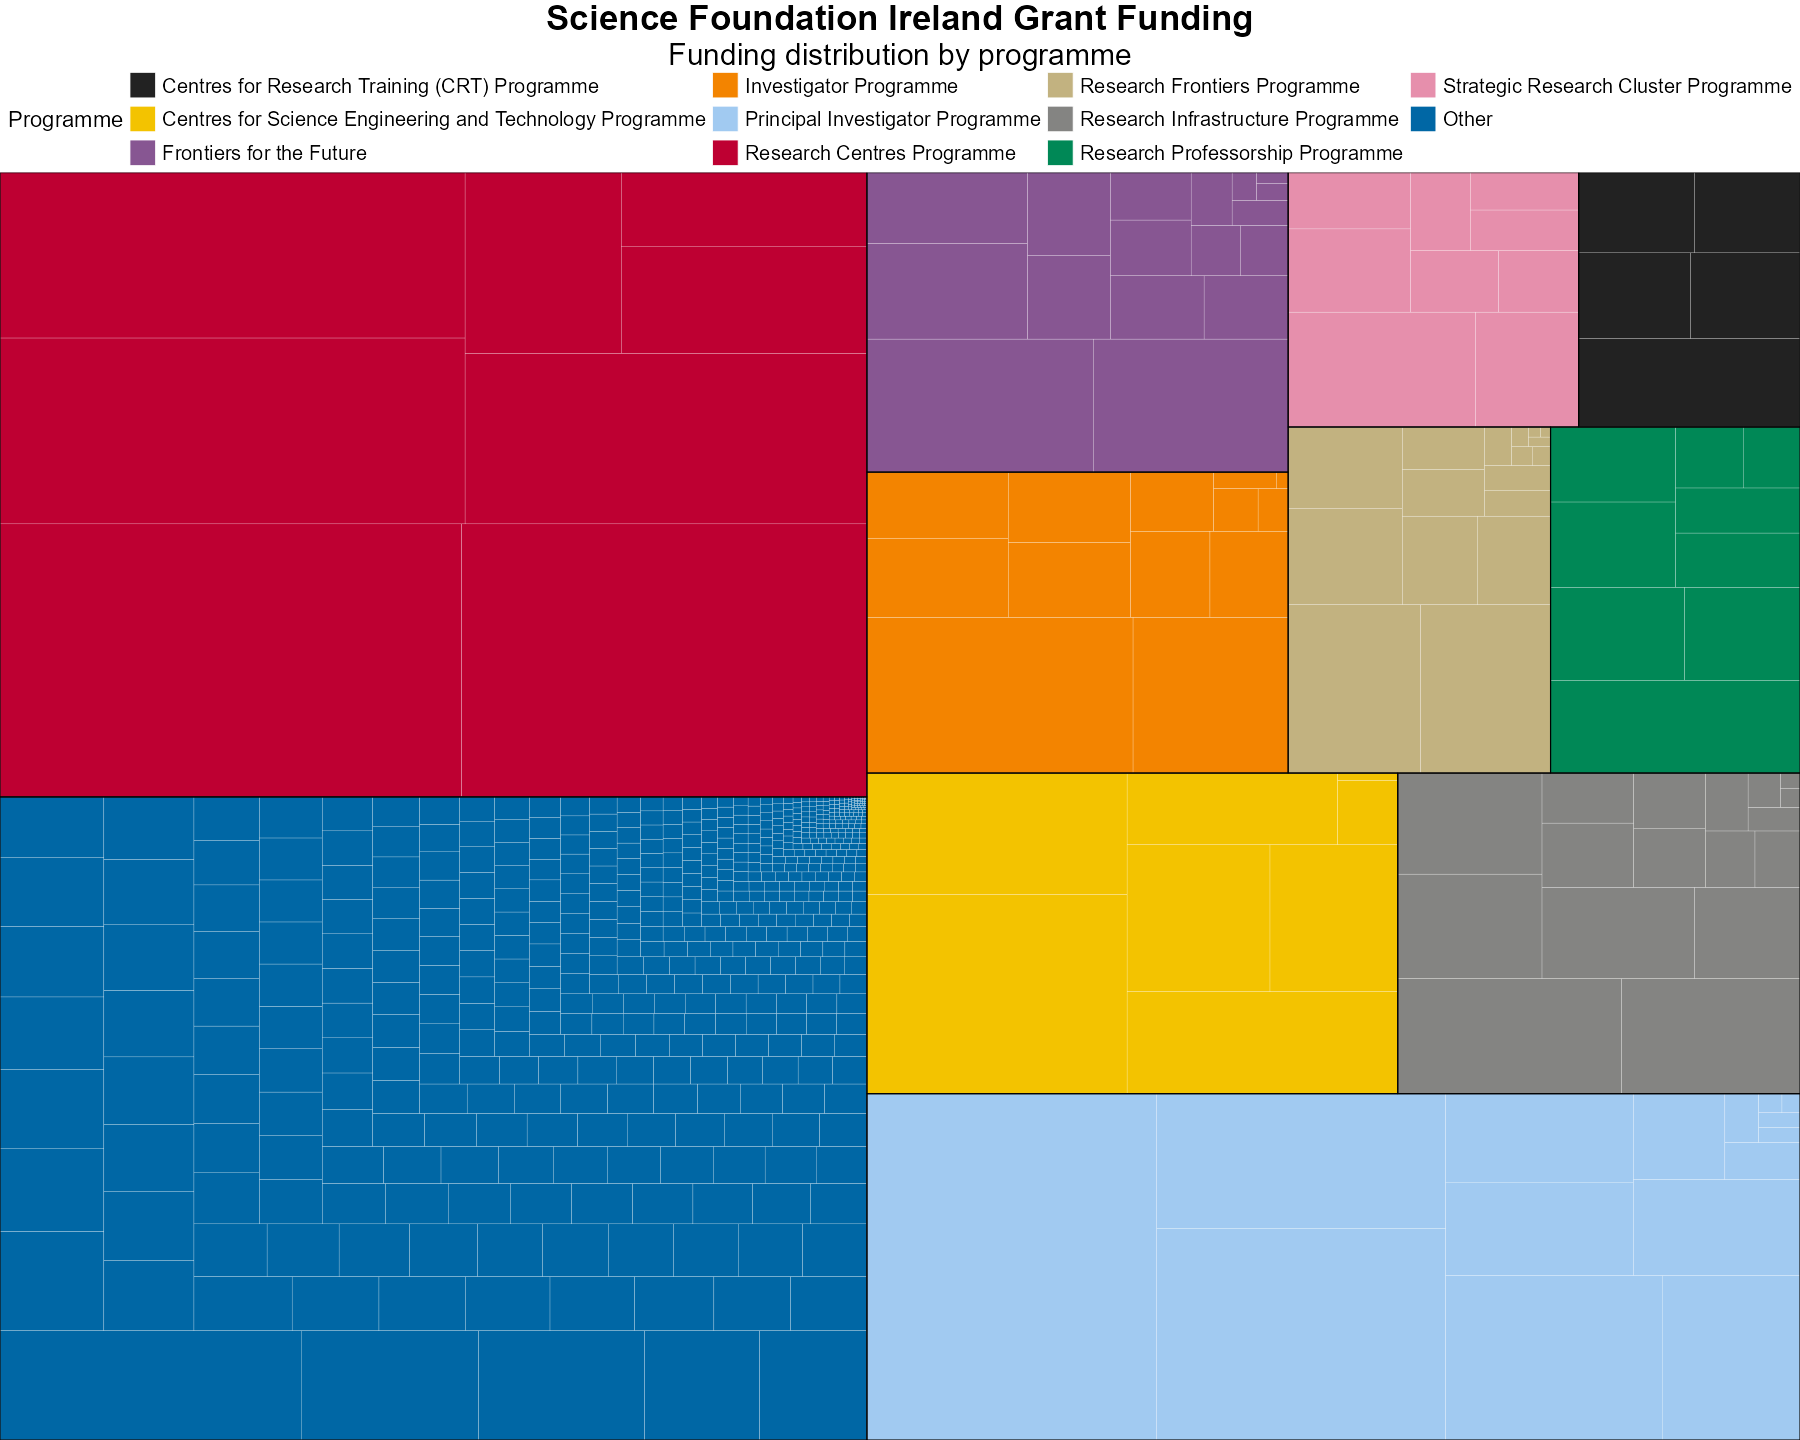
How are Science Foundation Grants distributed in Ireland?
Load Libraries
Load Data
tuesdata <- tidytuesdayR::tt_load('2026-02-24')
sfi_grants <- tuesdata$sfi_grants
Tree Map
treemap_data <- sfi_grants |>
  filter(!is.na(programme_name),
         !is.na(research_body)) |>
  group_by(programme_name, research_body) |>
  summarise(
    total_funding = sum(current_total_commitment, na.rm = TRUE),
    .groups = "drop") |>
  filter(total_funding > 0) |>
  mutate(
    programme_name = fct_lump(programme_name, n = 10, w = total_funding),
    research_body  = fct_lump(research_body, n = 15, w = total_funding))

plot <- ggplot(
  treemap_data,
  aes(
    area = total_funding,
    fill = programme_name,
    subgroup = programme_name)) +
  geom_treemap(color = "white", size = 0.3) +
  geom_treemap_subgroup_border(
    colour = "black",
    size = 1.5) +
  labs(
    title = "Science Foundation Ireland Grant Funding",
    subtitle = "Funding distribution by programme",
    fill = "Programme") +
  scale_cwb(name = "Programme", type = "d", palette = "discrete_21", aesthetics = "fill", guide = guide_legend(nrow = 3)) +
  theme_void() +
  theme(legend.position = "top",
        legend.text = element_text(size = 20),
        legend.title = element_text(size = 22),
        legend.key.size = unit(1, "cm"),
        plot.title = element_text(hjust = 0.5, size = 35, face = "bold"),
        plot.subtitle = element_text(hjust = 0.5, size = 30))

# Save and display images
current_dir <- dirname(knitr::current_input())
plot_name <- "funding_dist.png"

ggsave(plot = plot,
       dpi = "screen",
       width = 25,
       height = 20,
       device = ragg::agg_png,
       filename = file.path(current_dir, plot_name))


# Read the big plot
img <- image_read(file.path(current_dir, plot_name))

# Force 16:9 aspect ratio with minimal padding
# Target size: 1200x675 px (16:9)
img_card <- image_scale(img, "1200x675")           # scale to fit inside 16:9
img_card <- image_extent(
  img_card,
  geometry = "1200x675",
  gravity = "center"
)

# Save as card preview
image_write(img_card, path = file.path(current_dir, "preview.png"))

knitr::include_graphics(
  file.path(current_dir, plot_name)
)
References
cite_packages(format = "rmd")Wilkins D (2025). treemapify: Draw Treemaps in ‘ggplot2’. doi:10.32614/CRAN.package.treemapify https://doi.org/10.32614/CRAN.package.treemapify, R package version 2.6.0, https://CRAN.R-project.org/package=treemapify.
Baril C (????). trashpanda: Cole’s Personal Collection of R Functions, Themes, and Palettes. R package version 0.0.1, https://colebaril.github.io/trashpanda/.
Firke S (2024). janitor: Simple Tools for Examining and Cleaning Dirty Data. doi:10.32614/CRAN.package.janitor https://doi.org/10.32614/CRAN.package.janitor, R package version 2.2.1, https://CRAN.R-project.org/package=janitor.
Grolemund G, Wickham H (2011). “Dates and Times Made Easy with lubridate.” Journal of Statistical Software, 40(3), 1-25. https://www.jstatsoft.org/v40/i03/.
Wickham H (2025). forcats: Tools for Working with Categorical Variables (Factors). doi:10.32614/CRAN.package.forcats https://doi.org/10.32614/CRAN.package.forcats, R package version 1.0.1, https://CRAN.R-project.org/package=forcats.
Wickham H (2025). stringr: Simple, Consistent Wrappers for Common String Operations. doi:10.32614/CRAN.package.stringr https://doi.org/10.32614/CRAN.package.stringr, R package version 1.6.0, https://CRAN.R-project.org/package=stringr.
Wickham H, François R, Henry L, Müller K, Vaughan D (2023). dplyr: A Grammar of Data Manipulation. doi:10.32614/CRAN.package.dplyr https://doi.org/10.32614/CRAN.package.dplyr, R package version 1.1.4, https://CRAN.R-project.org/package=dplyr.
Wickham H, Henry L (2026). purrr: Functional Programming Tools. doi:10.32614/CRAN.package.purrr https://doi.org/10.32614/CRAN.package.purrr, R package version 1.2.1, https://CRAN.R-project.org/package=purrr.
Wickham H, Hester J, Bryan J (2025). readr: Read Rectangular Text Data. doi:10.32614/CRAN.package.readr https://doi.org/10.32614/CRAN.package.readr, R package version 2.1.6, https://CRAN.R-project.org/package=readr.
Wickham H, Vaughan D, Girlich M (2025). tidyr: Tidy Messy Data. doi:10.32614/CRAN.package.tidyr https://doi.org/10.32614/CRAN.package.tidyr, R package version 1.3.2, https://CRAN.R-project.org/package=tidyr.
Müller K, Wickham H (2026). tibble: Simple Data Frames. doi:10.32614/CRAN.package.tibble https://doi.org/10.32614/CRAN.package.tibble, R package version 3.3.1, https://CRAN.R-project.org/package=tibble.
Wickham H (2016). ggplot2: Elegant Graphics for Data Analysis. Springer-Verlag New York. ISBN 978-3-319-24277-4, https://ggplot2.tidyverse.org.
Wickham H, Averick M, Bryan J, Chang W, McGowan LD, François R, Grolemund G, Hayes A, Henry L, Hester J, Kuhn M, Pedersen TL, Miller E, Bache SM, Müller K, Ooms J, Robinson D, Seidel DP, Spinu V, Takahashi K, Vaughan D, Wilke C, Woo K, Yutani H (2019). “Welcome to the tidyverse.” Journal of Open Source Software, 4(43), 1686. doi:10.21105/joss.01686 https://doi.org/10.21105/joss.01686.
Ooms J (2025). magick: Advanced Graphics and Image-Processing in R. doi:10.32614/CRAN.package.magick https://doi.org/10.32614/CRAN.package.magick, R package version 2.9.0, https://CRAN.R-project.org/package=magick.
Harmon J, Hughes E (2025). tidytuesdayR: Access the Weekly ‘TidyTuesday’ Project Dataset. doi:10.32614/CRAN.package.tidytuesdayR https://doi.org/10.32614/CRAN.package.tidytuesdayR, R package version 1.2.1, https://CRAN.R-project.org/package=tidytuesdayR.
Rinker TW, Kurkiewicz D (2018). pacman: Package Management for R. version 0.5.0, http://github.com/trinker/pacman.