require(pacman)
p_load(tidytuesdayR, tidyverse, janitor, here, trashpanda, ggside, magick)2026 Winter Olympics
sports
olympics
2026 Winter Olympics Schedules
Load Packages
Load Data
tuesdata <- tidytuesdayR::tt_load('2026-02-10')
schedule <- tuesdata$schedule
Data Cleaning
schedule_intervals <- schedule |>
  mutate(length = end_datetime_local - start_datetime_local)


events <- schedule |>
  select(-date, -day_of_week) |>
  distinct(.keep_all = TRUE)

time_grid <- tibble(
  time = seq(
    from = floor_date(min(events$start_datetime_local), "hour"),
    to   = ceiling_date(max(events$end_datetime_local), "hour"),
    by   = "60 min"
  )
)

density <- events |>
  mutate(key = 1) |>
  inner_join(time_grid |> mutate(key = 1), by = "key", relationship = "many-to-many") |>
  filter(start_datetime_local <= time, end_datetime_local > time) |>
  count(time, discipline_name, name = "n_events") |>
  mutate(total = sum(n_events), .by = discipline_name) |>
  mutate(discipline_name = fct_reorder(discipline_name, total))

sidex <- density |>
  summarise(total_events = sum(n_events), .by = time)

sidey <- events |>
  summarise(total_events = n(), .by = discipline_name)
Plot
plot <- ggplot(density, aes(x = time, y = discipline_name)) +
geom_point(aes(size = n_events, fill = discipline_name), alpha = 0.85,
position = position_jitter(),
pch = 21, colour = "black") +
geom_xsideline(
data = sidex,
aes(y = total_events, x = time),
inherit.aes = FALSE,
linewidth = 0.5,
colour = "cadetblue4",
alpha = 0.9) +
geom_ysidecol(
data = sidey,
aes(x = total_events, y = discipline_name),
inherit.aes = FALSE,
fill = "cadetblue4",
alpha = 0.9
) +
scale_size_continuous(range = c(2, 5), guide = guide_legend(nrow = 1)) +
scale_xsidey_continuous(breaks = c(2, 5, 8)) +
scale_fill_viridis_d(option = "mako", guide = "none") +
scale_x_datetime(
expand = c(0.005, 0),
date_breaks = "2 days",
date_labels = "%b %d") +
labs(
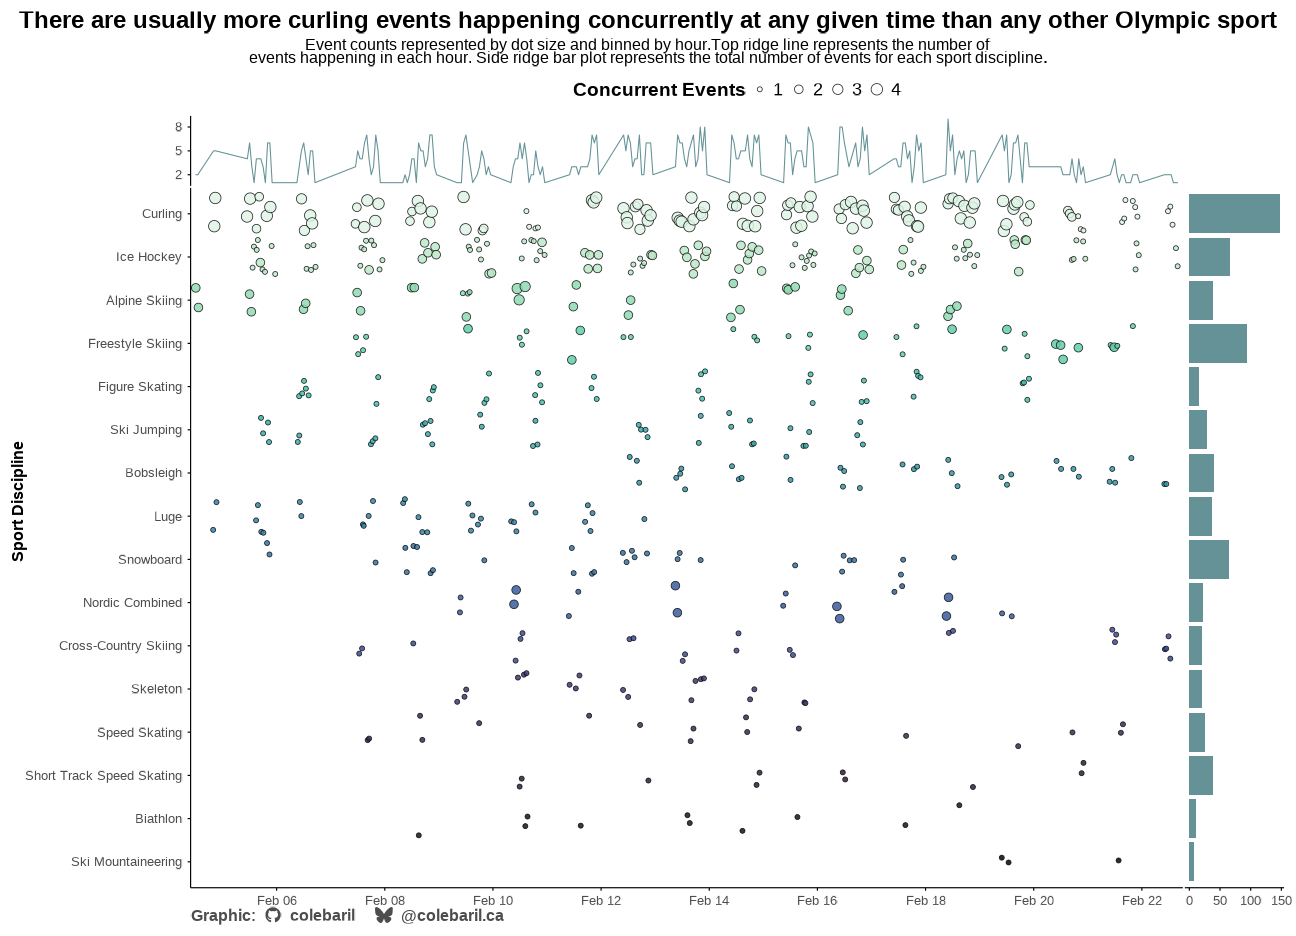
title = "There are usually more curling events happening concurrently at any given time than any other Olympic sport",
subtitle = "Event counts represented by dot size and binned by hour.Top ridge line represents the number of\nevents happening in each hour. Side ridge bar plot represents the total number of events for each sport discipline.",
x = NULL,
y = "Sport Discipline",
size = "Concurrent Events") +
theme_cole(remove_grid = TRUE) +
theme(legend.position = "top") +
add_caption_cwb(type = "plot")
current_dir <- dirname(knitr::current_input())
ggsave(plot = plot,
dpi = "screen",
width = 18,
height = 13,
device = ragg::agg_png,
filename = file.path(current_dir, "concurrent_olympic_events.png"))
# Read the big plot
img <- image_read(file.path(current_dir, "concurrent_olympic_events.png"))
# Force 16:9 aspect ratio with minimal padding
# Target size: 1200x675 px (16:9)
img_card <- image_scale(img, "1200x675") # scale to fit inside 16:9
img_card <- image_extent(
img_card,
geometry = "1200x675",
gravity = "center"
)
# Save as card preview
image_write(img_card, path = file.path(current_dir, "preview.png"))
knitr::include_graphics(
file.path(current_dir, "concurrent_olympic_events.png")
)
References
cwb::cite_packages(format = "rmd")Ooms J (2025). magick: Advanced Graphics and Image-Processing in R. doi:10.32614/CRAN.package.magick https://doi.org/10.32614/CRAN.package.magick, R package version 2.9.0, https://CRAN.R-project.org/package=magick.
Landis J (2025). ggside: Side Grammar Graphics. doi:10.32614/CRAN.package.ggside https://doi.org/10.32614/CRAN.package.ggside, R package version 0.4.1, https://CRAN.R-project.org/package=ggside.
Baril C (????). trashpanda: Cole’s Personal Collection of R Functions, Themes, and Palettes. R package version 0.0.1, https://colebaril.github.io/trashpanda/.
Müller K (2025). here: A Simpler Way to Find Your Files. doi:10.32614/CRAN.package.here https://doi.org/10.32614/CRAN.package.here, R package version 1.0.2, https://CRAN.R-project.org/package=here.
Firke S (2024). janitor: Simple Tools for Examining and Cleaning Dirty Data. doi:10.32614/CRAN.package.janitor https://doi.org/10.32614/CRAN.package.janitor, R package version 2.2.1, https://CRAN.R-project.org/package=janitor.
Grolemund G, Wickham H (2011). “Dates and Times Made Easy with lubridate.” Journal of Statistical Software, 40(3), 1-25. https://www.jstatsoft.org/v40/i03/.
Wickham H (2025). forcats: Tools for Working with Categorical Variables (Factors). doi:10.32614/CRAN.package.forcats https://doi.org/10.32614/CRAN.package.forcats, R package version 1.0.1, https://CRAN.R-project.org/package=forcats.
Wickham H (2025). stringr: Simple, Consistent Wrappers for Common String Operations. doi:10.32614/CRAN.package.stringr https://doi.org/10.32614/CRAN.package.stringr, R package version 1.6.0, https://CRAN.R-project.org/package=stringr.
Wickham H, François R, Henry L, Müller K, Vaughan D (2023). dplyr: A Grammar of Data Manipulation. doi:10.32614/CRAN.package.dplyr https://doi.org/10.32614/CRAN.package.dplyr, R package version 1.1.4, https://CRAN.R-project.org/package=dplyr.
Wickham H, Henry L (2026). purrr: Functional Programming Tools. doi:10.32614/CRAN.package.purrr https://doi.org/10.32614/CRAN.package.purrr, R package version 1.2.1, https://CRAN.R-project.org/package=purrr.
Wickham H, Hester J, Bryan J (2025). readr: Read Rectangular Text Data. doi:10.32614/CRAN.package.readr https://doi.org/10.32614/CRAN.package.readr, R package version 2.1.6, https://CRAN.R-project.org/package=readr.
Wickham H, Vaughan D, Girlich M (2025). tidyr: Tidy Messy Data. doi:10.32614/CRAN.package.tidyr https://doi.org/10.32614/CRAN.package.tidyr, R package version 1.3.2, https://CRAN.R-project.org/package=tidyr.
Müller K, Wickham H (2026). tibble: Simple Data Frames. doi:10.32614/CRAN.package.tibble https://doi.org/10.32614/CRAN.package.tibble, R package version 3.3.1, https://CRAN.R-project.org/package=tibble.
Wickham H (2016). ggplot2: Elegant Graphics for Data Analysis. Springer-Verlag New York. ISBN 978-3-319-24277-4, https://ggplot2.tidyverse.org.
Wickham H, Averick M, Bryan J, Chang W, McGowan LD, François R, Grolemund G, Hayes A, Henry L, Hester J, Kuhn M, Pedersen TL, Miller E, Bache SM, Müller K, Ooms J, Robinson D, Seidel DP, Spinu V, Takahashi K, Vaughan D, Wilke C, Woo K, Yutani H (2019). “Welcome to the tidyverse.” Journal of Open Source Software, 4(43), 1686. doi:10.21105/joss.01686 https://doi.org/10.21105/joss.01686.
Harmon J, Hughes E (2025). tidytuesdayR: Access the Weekly ‘TidyTuesday’ Project Dataset. doi:10.32614/CRAN.package.tidytuesdayR https://doi.org/10.32614/CRAN.package.tidytuesdayR, R package version 1.2.1, https://CRAN.R-project.org/package=tidytuesdayR.
Rinker TW, Kurkiewicz D (2018). pacman: Package Management for R. version 0.5.0, http://github.com/trinker/pacman.